Insights
Metrics that show what memory is doing for you — value, quality, and health.
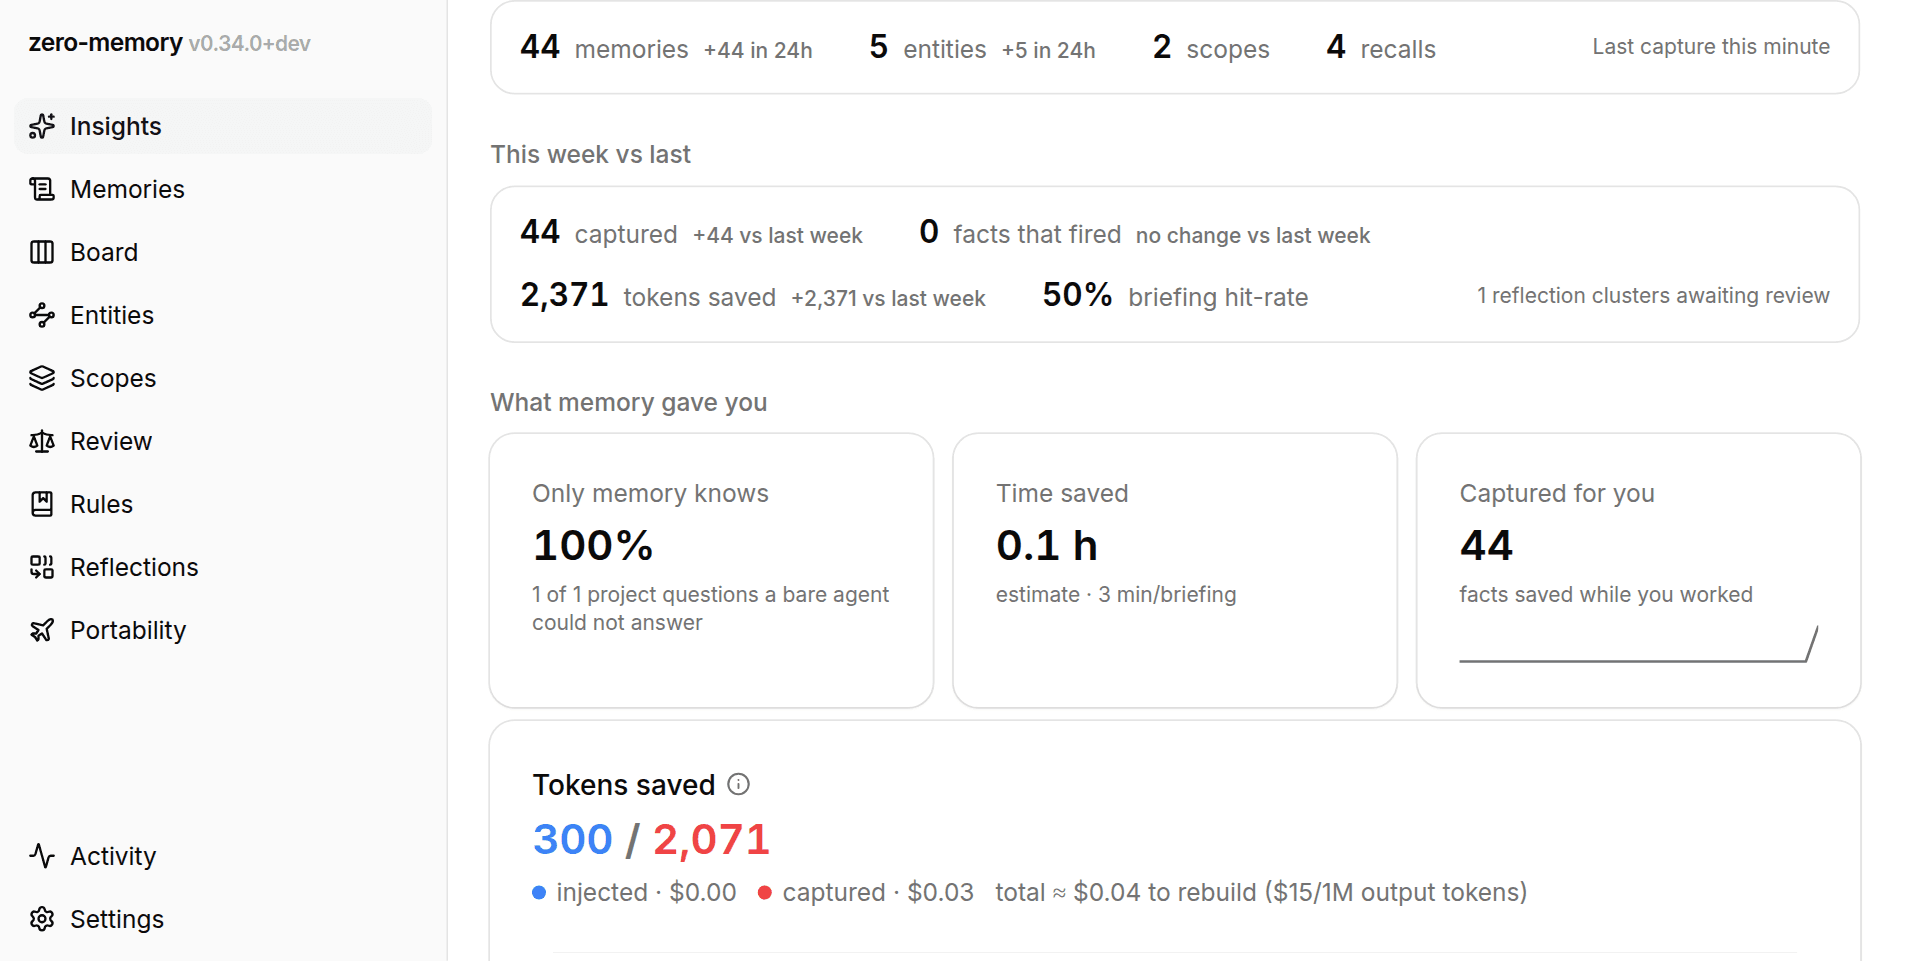
The Insights page, titled Your impact on screen and serving as the
dashboard's landing page at /, turns raw usage into an answer to a simple
question: what is memory actually doing for me? It aggregates your usage events
and your memories over a time window — 7, 30, or 90 days, selectable on the
page, with 30 days as the default — and presents the result as a small set of
KPI tiles, an inventory strip, and drill-down views.
How the numbers are computed
All aggregation happens inside the database, in calls scoped strictly to the signed-in user. Raw usage events are operational data and are never exposed to the browser: the page receives only your aggregates, and one user's numbers are invisible to another by construction. A fresh account sees a friendly empty state instead of empty charts. Work with memory for a while, and the page fills in.
Before the tiles: the compounding view
The page opens with a Compounding context chart of facts captured for you, accumulated across the window. Context that accrues across sessions instead of resetting each time is the point of the product, so it gets the hero spot.
Below it, an inventory strip shows totals for memories, entities, and scopes with 24-hour growth deltas ("+N in 24h"), the all-time recall count, and a last-capture freshness stamp. A This week vs last digest compares the current seven days with the prior seven: captured, facts that fired, tokens saved, and the briefing hit-rate, each with a signed delta. The digest ignores the page's window selector, and notes when reflection clusters are awaiting your review. When briefings come back thin (fewer than half had context), the page shows a warning banner — a health alarm, not a KPI of its own.
Four questions, four tile rows
The KPI grid is organized as four questions, each answered by tiles with a consistent reading:
| Question | Tiles |
|---|---|
| Value — what has memory given me? | Only memory knows · Time saved · Captured for you · Tokens saved |
| Quality — is what it gives me good? | Usefulness · Surfaced-fact age · Context precision |
| Health — is the memory store healthy? | Still trusted · Empty recalls |
| Age — how is the corpus aging? | Faded in ranking · Corpus age |
The test for a KPI tile is: does this number change what you do next? Everything that fails that test, such as activity counts and inventory, is still on the page, but demoted to supporting rows rather than shown as a KPI.
Value
Only memory knows is the outcome metric: the share of project questions a bare agent could not answer without memory, measured by the counterfactual benchmark. With no benchmark run yet, the tile invites you to run one instead of showing 0%. Time saved is a conservative estimate derived from briefing hits, counting the re-orientation each briefing avoided, in hours. Captured for you counts memories written by agents while you worked, over the window: knowledge that got persisted without you transcribing it. An Extraction budget tile appears only when a usage ceiling is actually in force on this deployment; with none, there is nothing to report.
Tokens saved is one combined card with two series. Injected is context recalled from memory and fed into your sessions, which is what you didn't retype; captured is facts written to memory for you. Each carries a per-day sparkline and a "total ≈ $ to rebuild" estimate of what regenerating those tokens would cost.
Quality
Usefulness is a phased tile. Judging whether recalled facts actually helped requires enough judged recall events to be meaningful, so below a coverage threshold (25 judged events in the window by default) the tile shows a reinforcement-based proxy with an explicit "proxy" badge; once coverage is sufficient it switches to the measured usefulness hit rate. The two are never shown side by side, because two percentages over different denominators read as a contradiction. See Recall quality for how the judgment works.
Surfaced-fact age gives the median age of the facts your recalls surface, and the share older than 90 days. Relevance is not freshness: a perfectly matching but outdated fact is its own failure mode. Context precision asks how many of the facts that surfaced in recalls were actually on topic. It is computed only over judged facts, so a sparse judge never deflates the number, and with no watcher connected the tile says so ("connect a watcher to see this") instead of showing a misleading 0%.
Quality tiles carry per-day sparklines once the judge has produced a signal. Scoring is continuous by construction: the watcher's judge evaluates every ingested conversation, so quality is measured as you work, with no separate sampling process.
Health
Still trusted is the share of your memories that are still live, neither invalidated nor superseded. The tile hints that this is a balance, not a maximum — a store where nothing is ever retired is not being curated.
Empty recalls is the share of recalls that returned nothing over the window. A rising rate means agents are asking questions memory cannot yet answer. The tile links straight to the activity log filtered to those empty recalls, so the number is inspectable.
How it ages
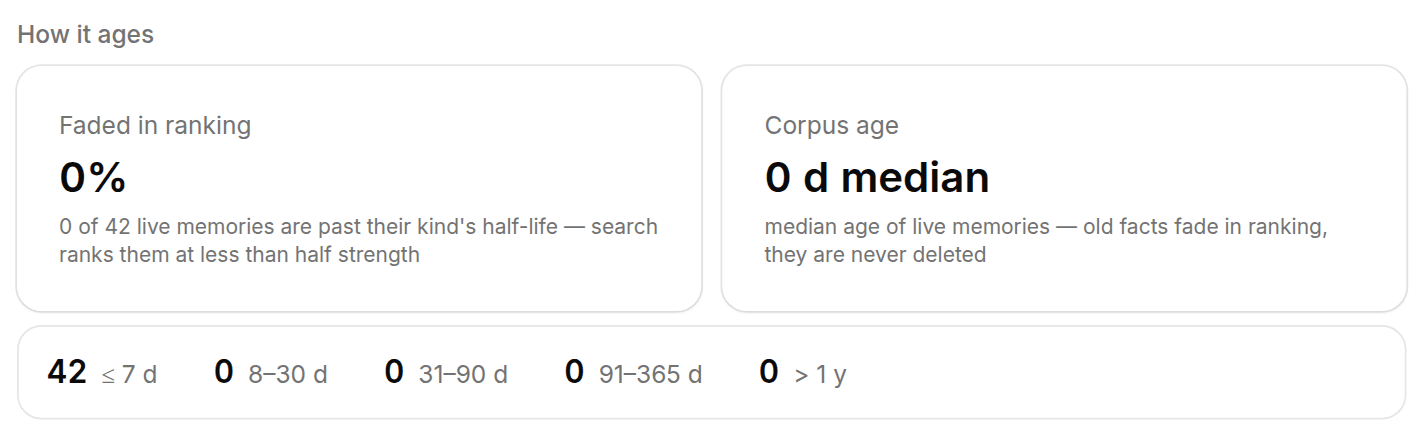
Faded in ranking is the share of live memories past their kind's half-life, which search now ranks at less than half strength. Old facts fade in ranking; they are never deleted. See Decay, reflection, and reinforcement. Corpus age is the median age of your live memories.
An age-bucket strip below the two tiles shows how the live corpus distributes across ≤ 7 days, 8–30, 31–90, 91–365, and older than a year.
Activity, top facts, and the log
Activity over time — recall and capture volume per day, with the window's recall count in the title — gets its own chart below the KPIs; call counts are context, not KPIs.
Top facts lists the five memories that surfaced most often in recalls during the window, with their content and kind. Only facts you own appear here; memories other people shared with you are never listed, even as identifiers.
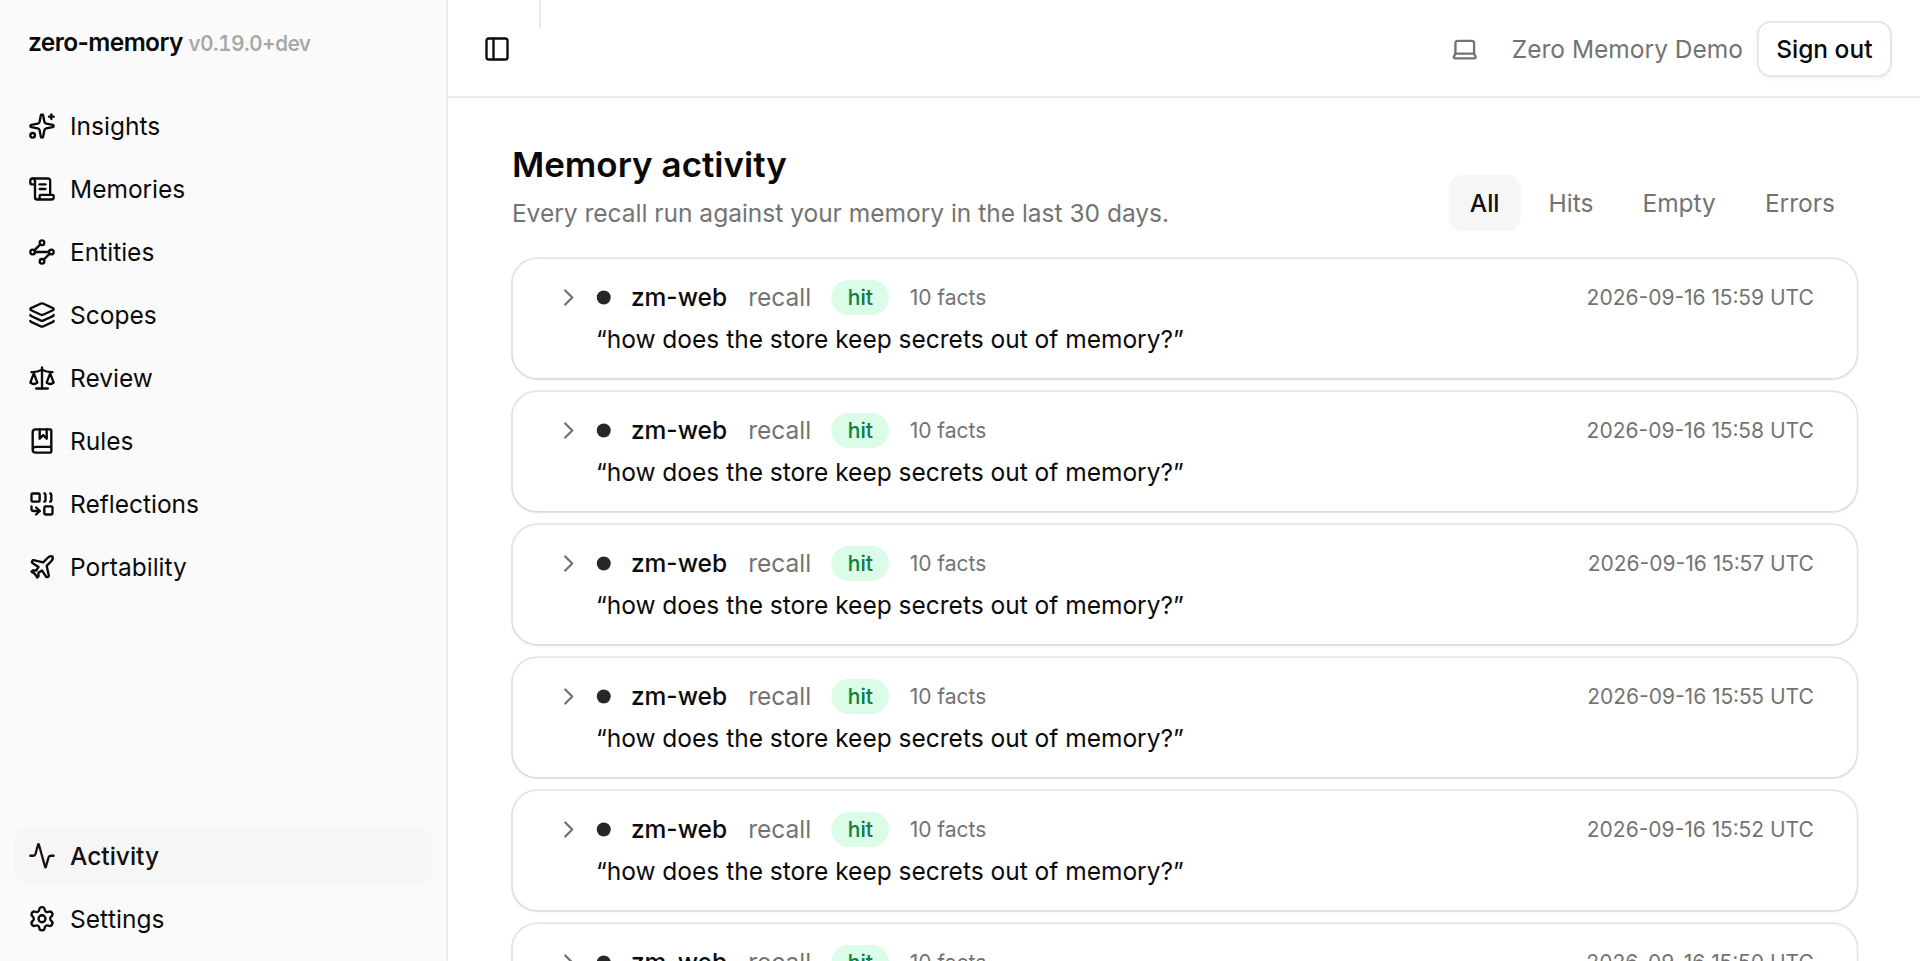
The memory activity log gets its own screen, Activity, at the bottom of
the sidebar: a paginated feed of individual recall and build_context calls
over the last 30 days, with All / Hits / Empty / Errors filters. Each entry is
two lines. The first gives when, which agent (each agent keeps a stable color)
and the outcome as a hit / empty / error badge; the second is the query that
was sent, so what was asked reads off the feed without opening anything. A
chevron marks the entry as expandable: opening it reveals the facts it
surfaced and the request id for correlating with logs. Your own facts link to
their detail pages with a preview, while a fact someone shared with you shows
as a bare, non-navigable id. A call that surfaced more facts than the row shows
keeps the tail behind a "+N more" disclosure that opens in place, so the feed
is not re-rendered and the entry you are reading stays where it is. Searches
you run from the dashboard search appear here
attributed to the web client but are excluded from the agent metrics above.
Per-fact validity windows (valid from → invalidated or present) and the chain of supersessions live on each memory's detail page, described in Supersede and versioning.